http://tuxgraphics.org/electronics

Ethernet host watchdog, 4.X
![[Illustration]](../../common/images2/article090201/host_wd.jpg)
Abstract:
A watchdog is a piece of equipment that supervises other systems
and resets them in case it detects that those systems are failing.
Such watchdogs can be used to make systems more reliable. Reliability is
a major cost factor in many cases. Think about remote equipment where
it might take hours to get on site and service it.
Think about a WIFI access point on
a mountain site.
A crucial factor is of course also the reliability of the watchdog. A small,
independent watchdog device is therefore generally better then a
software only solution implemented in the system itself. The Linux kernel
has e.g such a watch dog called "softdog".
This softdog can help a lot to
improve the reachability of a server but it can not cover all possible
cases because it is part of the failing system. Finally a watchdog can never cover a total equipment failure. It is a
good remedy for temporary problems that go away after a reboot.
This watchdog has not only the possibility to reset a system but it can
as well be used to monitor voltages. E.g a backup battery pack. You can
measure two voltages in the range from 0-30V DC.
The watchdog supports SNMP V1 to allow for a seamless integration into
exiting network management system. The user interface of the watchdog
is a set of web pages all served directly by the on-board webserver..
An additional feature of this watchdog is that it can measure
voltages and those voltages can be read out with a web browser
or via SNMP. A SNMP voltmeter!
_________________ _________________ _________________
|
The idea
The idea of a network equipment watchdog is based on the requirements and ideas
of a customer who needed to improve the reliability of telecommunication
equipment.
This equipment was just hanging once in a while and he had to manually monitor
the system around the clock to be able to reset it in case it was stuck again.
He wanted some device to automatically monitor the system and to automatically
recover it.
Ping
A simple way of detecting if network equipment is up is to send a ping and
see if there is a reply. Such a ping (ICMP echo) can therefore be used to monitor network
equipment.
A problem is however the case of a system that is "half up". Think of a
webserver. The network interface might be up but somehow the apache webserver
application died. In this case the machine would be ping-able but the
web server would actually not work. We could poll a specific web-page to fix this.
A web-server is however only a very specific case. How can we generalize the
solution for other systems? One could run a script on the server itself that
would execute a number of tests to see if the system was in good shape.
If everything was OK then the script can send a ping to the watchdog. In this
case it is not the watchdog that originates the ping but the "health check
script" on the monitored equipment that sends once in a while a ping to the watchdog to
say "I am OK".
Only if those pings are missing for a period of time then the watchdog
will reset the system.
Time to reboot
We must pay special attention to the way systems reboot. Let's say we
expect an "alive signal" (=ping/reply) from the monitored network equipment
every 20sec. After 6 missing ping/reply we would initiate a reboot. In other words a little bit after
120sec we would initiate a reboot. The system reboots but that takes
time. Maybe be 5 minutes or 10 minutes. We must avoid to reboot the system
during the startup otherwise it will never finish the startup.
The solution is to put the watchdog after a reset into a "passive state". In
this state it will continue to monitor the system but it will not initiate a
new reset. Only when the watchdog gets again the first "I am alive indication"
then the watchdog will go back into an "active state" where it would initiate
again a reboot/reset in case of a failure.
This way it does not really matter how long the startup of the system takes.
The hardware

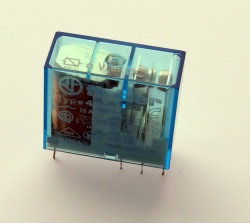
The tuxgraphics ethernet board has on pin PD7 the possibility to connect a
relay. Relays do usually have a contact that opens and one that closes.
Dependent on whether you want to reset the monitored equipment or you want
to disconnect it for a moment from power you can use one of the two relay contacts.
The Ethernet board will just supply a current for a short moment to the relay at the time
of the reset/restart.
The hardware is therefore very simple. Just take the standard tuxgraphics
ethernet board and connect a relay to it.
A new feature of the version 4.X watchdog is the possibility to measure
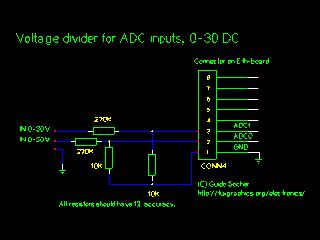
voltages. To use this feature you need two pairs of additional resistors
what are to be connected as voltage dividers. The dot-matrix field
of the tuxgraphics ethernet board makes it easy to add those resistors.

Circuit diagram: ADC voltage divider. Click on the image for a PDF version.
The tuxgraphics host watchdog

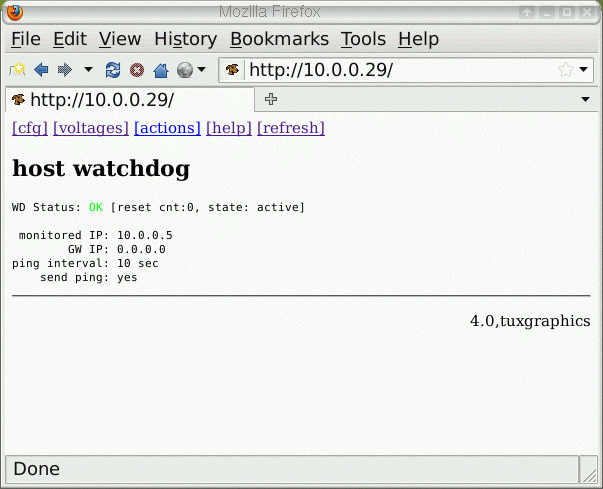
The watchdog is configurable via its own web-pages. You just point your
web browser to it and you can see the state of the system, how often it had
to be reset, if the watchdog is active or passive etc.... You can also
configure if ping shall be sent from the watchdog or if the system will
ping the watchdog.
The watchdog has its own online help. Have a look.
Measuring voltages


The watchdog allows you to monitor 2 voltages with very high accuracy. Using
a technology known as oversampling we achieve 12bit accuracy. Today we don't
realize how precise that is. We just throw around those numbers 10bit, 12bit
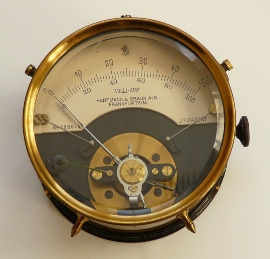
16bit without really being able to relate to them. Therefore take a look
at the photo of a hand tuned high precision meter from the early 20th century.
What's the range and the precision? It shows values from 0 to 50 with the smallest division being 1.
In today's speak that would be 6bit accuracy!
The voltmeters provided
by the watchdog can be calibrated. See the README file inside the software
package for details. You will however notice
that even if you take a number of good quality digital voltmeters they
will all show slightly different values for the same voltage. That
is absolutely normal. The manual of a DVM may e.g say +/-0.8% and +/- 2LSB
and this is a good quality voltmeter. The main
added value of having two digits behind the decimal point is not so much
to be able to say that this battery has exactly 12.01V but to see a trend.
E.g 12.03V is higher than 12.01V.
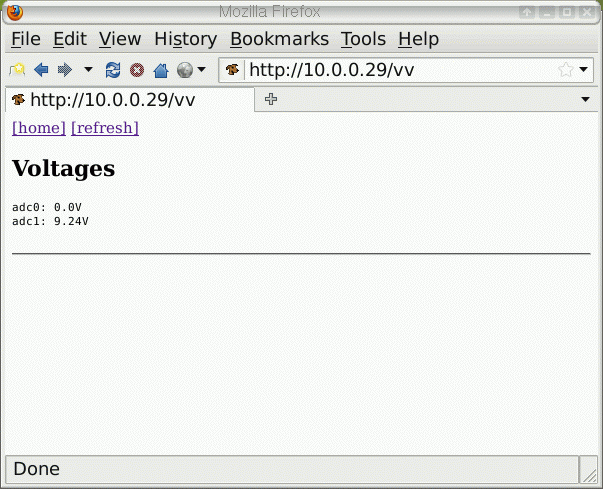
Voltages can be read out via a web browser or via SNMP.
SNMP support
SNMP stands for Simple Network Management Protocol and is the de facto
standard for the management of all kind of network equipment from
routers to switches, printers and servers. All major data centers use it.
This watchdog supports SNMP and integrates therefore nicely into an
existing management system.
How does SNMP work?
SNMP is a UDP based protocol and the messages are encoded in
ASN.1. ASN.1 is a generic encoding format. You can think of it
as the XML of the 1980s. It can be used to encode any kind of data in binary
format by using the syntax "Tag Length Value".
Being a binary encoding format it provides still very compact messages,
more compact than XML, because the tags are short.
SNMP is based on the manager/agent model. The agent is basically the
SNMP piece of software running in the network element and the manager
is central node from where the network is supervised.
In other words the tuxgraphics network watchdog is an SNMP agent.
The most wide spread protocol version of SNMP is version 1. It uses
for access control a simple "password" mechanism known as "community string".
The agnet will only answer if the community string matches. If that
"community string" password does not match then it will not reply. Not
even with an error. A convention is to set the "community string" to "public" if
no password protection is needed or wanted.
Some people have criticized SNMP as insecure because of this very simple
and straight forward mechanism. It is true that it could be a risk if
you plan to use SNMP for configuration changes (snmp-set command) but
for read only access (snmp-get, snmp-getnext) this is a perfect solution.
The tuxgraphics network watchdog implements the read-only commands snmp-get and
snmp-getnext.
No data can be changed via SNMP.
The SNMP accessible data is ordered in a tree of numbers. This is structure is
called MIB. This sounds complicated but all that means is that
each data field is accessed by a number e.g 1.3.6.1.4.1.42.1
This long number is called OID and is just an address. Using a
SNMP getnext command you can say give me the data at 1.3.6.1.4.1.42.1.
These numbers are then documented in a MIB. The MIB is a text file which
gives names and descriptions to the long numbers. This makes
it easier to understand what the meaning of the data is.
The MIB for the watchdog can be downloaded at the end of this article.
To read a specific value you do not necessarily need the MIB file
to be integrated into your management system. You can just use
the snmpget command to read a specific value or snmpwalk to read
all information fields:
snmpget  -c public -v 1 10.0.0.29 1.3.6.1.4.1.42.4
 TUXGRAPHICS-HWD-MIB::voltage0 = STRING: 1.0V


snmpwalk  -c public -v 1 10.0.0.29 1.3.6.1.4.1.42.0
 TUXGRAPHICS-HWD-MIB::name = STRING: host watchdog
 TUXGRAPHICS-HWD-MIB::resetCnt = INTEGER: 0
 TUXGRAPHICS-HWD-MIB::status = INTEGER: 0
 TUXGRAPHICS-HWD-MIB::state = STRING: active
 TUXGRAPHICS-HWD-MIB::voltage0 = STRING:  1.0V
 TUXGRAPHICS-HWD-MIB::voltage1 = STRING:  1.3V
 End of MIB
The "10.0.0.29" is the IP address of the watchdog in the above example. Replace
it with the IP address or the hostname you gave to your watchdog.
References/Download
© Guido Socher, tuxgraphics.org
2011-02-01, generated by tuxgrparser version 2.57
![[Illustration]](../../common/images2/article090201/host_wd.jpg)
