home |  electronics |  toolbox |  science club |  tuxtalk |  photos |  e-cards |  online-shop

http://tuxgraphics.org/electronics


Content:
By Guido Socher


Embedded client

[Illustration]

Abstract:

Until now tuxgraphics ethernet boards with their networking software have mostly been used as standalone servers. This is now a new generation of systems which work as clients in combination with a server system in the cloud. The advantage: you just plug it into your network and it is up and running.

There is no need to re-configure your DSL-router for port forwarding. You can literaly give this board to somebody and tell him/her connect it to one of the ethernet jacks on the back of a DSL-router and that's all.

The base hardware is the tuxgraphics ethernet board and you can purchase a board pre-loaded with firmware. No C-programming skills required even if you want to change the way the data is presented.

_________________ _________________ _________________


The idea

The idea for a network client that reports data to a server was born a while ago when a marketing company contacted me. They wanted to display water and air temperatures live on their homepage. The event for which this was used would only last a few days and therefore no DSL-internet connection was available. The only way to connect to the internet was via a 3G-mobile phone.

The problem with mobile networks is that they allow only client applications. There is not a single wireless network operator in the world that allows you to run a server on the phone or on a computer behind the phone. Big firewalls block all traffic to such a server.

It might be annoying that the network service provider's firewall limits you in the way you can use your computers but an embedded client system is actually a good idea. It is in many ways easier to use than a standalone web server. It just requires the right infrastructure in the cloud.  

Easy to use

The embedded client system uses a DHCP client to obtain an IP address and other network parameters such as gateway address and the netmask from your DSL-router or Cable-router. This process is totally automatic and happens as soon as board is powered on.

The board uploads then periodically measurements to a server in the internet (aka server in the cloud). When you purchase an embedded client board pre-loaded with software then the access to the data receiving server is included.

To view data sent out by the embedded client board you just access a page generated by the server in the cloud.

[cloud computing]
How cloud computing works for the embedded client board

Just the use of a DHCP client and the possibility to run this system even if your ISP blocks the use of a web server at your end are not the only things you get here.

If one uses the tuxgraphics ethernet board as a stand alone web server and one wants to change the layout of the page or do some mathematical computation before displaying the sensor readings then the only way to do this was until now: Change the C-code, re-compile it and load it into the board.

The server in the cloud is more powerful. It provides a graphical dashboard where one can do such changes in a few seconds. It's easier and less error prone. You access the tuxgraphics data services with its dashboard simply via your web browser.  

A dashboard in the networking cloud

After logging into your account you are in front of a dashboard where you can manage all the data received from the embedded client board.

[data services dashboard]
The dashboard

The data as reported by your embedded client board is shown at the bottom of the dashboard page in raw format and the dashboard itself offers various tools to present the data in a nice way. The dashboard has its own documenation where the using of the different tools is explained.  

Let me customize my page

The presentation and customisation of data is done via templates. A "Template Manager" allows you to create HTML web pages with some special server side includes. Thus if you know HTML you will find it very easy to customize and create those pages. If you are new to this then don't worry. We have examples in the manual for the "Template Manager" and you can just copy and paste those examples and use them.

[different ways to present your data in web pages]
Analyzing and presenting the data in different ways.

The web pages created via the templates can then be used to view the data just for your own use on your PC or mobile phone or you can include it into your homepage such that it is available to anybody.

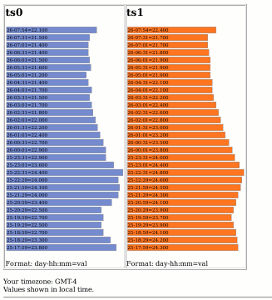
Bar graph (click for a bigger picture)
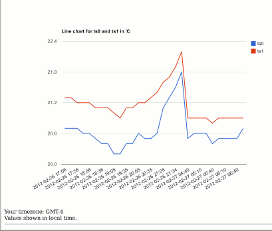

Line chart (click for a bigger picture)
 

Plotting Graphs

Historical data can be shown in graphs. At this point there are two types of graphs available: Bar graphs work in almost any html browser even very old ones. Line charts use HTML5 features and can therefore only be used in recent PC web browsers. They will probably not work on mobile phones.  

Tell me about abnormal conditions (alerts)

With a server system in the network cloud it becomes very easy to configure notification filters which will send out an email once a configured condition is met.

You can e.g say if temperature sensor ts0 reports values below 0'C then send me an email.

To create/delete an alert click on "Manage alerts".

In the alert manager you have comparison operators (> greater, < less than, == equal) as well as logical operators (&& and, || or). To say "notify me if the temperature of ts0 falls below 0", you would specify the alert rule:
ts0 < 0


System 1: Temperature

This system allows you to connect two DS18S20 digital temperature sensors. Those sensors are already calibrated during production. The sensors are connected in parallel to the ethernet board as shown in the below diagram.

[circuit diagram, click for a PDF version]
Circuit diagram, click for a PDF version

The pin-out of the sensor is as follows:
[ds18s20 pinout]
ds18s20 pinout


System 2: Max-ADC, measuring a number of analog values

This system allows you to monitor up to 8 analog voltages. The voltages can be any DC voltage such as e.g readings from an analog sensor (e.g from a LM335 temperature sensor). All the voltages have a common GND reference point.

We use 4 fold oversampling to double the resolution of the microcontroller internal digital analog converter.

[circuit diagram, click for a PDF version]
Circuit diagram, click for a PDF version

The analog to digital converter converts voltages on the input pins ADC0..ADC8 into integer values. 0 .. 1.1V corresponds to 0 .. 2046

In other words an ADC reading "A" can be converted into the corresponding voltage "U" by using this formula: A / 2046 * 1.1V = U

Of course you can measure much higher voltages than just 1.1V and each of the 8 different ADC channels could measure a different range. E.g ADC0 measures a signal between 0 and 1.1V, ADC1 could measure something between 0 and 30V, etc ... To measure DC voltages higher than 1.1V one just needs to add a voltage divider. A voltage divider is consists just of two resistors.

Here is a little javascript based web page that allows you to calculate and dimension the voltage divider:
voltage-div-calc.html  

Using it as a stand-alone server

These embedded client boards are not only clients that up-load data to a server. They do actually run as well a web server. You can use it as a web server either in combination with the features that the cloud offers you or just as a stand-alone server by disabling the data-upload.

[stand-alone web server]
Temperature measurements shown by the stand-alone
web server running on the board.
[stand-alone web server]
ADC channels shown by the stand-alone
web server running on the board.


Status info

The built-in web-server provides a user interface to configure the board and get status information which can be very helpful to troubleshoot problems.

[status information shown by the board's own web server]
status information shown by the board's own web server


Robustness

The tuxgrahics ethernet boards are not only excellent in terms of hardware quality. The embedded client firmware is as well made such that it can handle service interruptions without loosing data. Internet service providers do perform regularly maintenace and networks are especially at night quite frequently down. The embedded client board will therefore buffer data if the up-loading of the data into the cloud did not succeed. It can buffer up to 12 records and how long that is depends then on the configured up-load interval. With a factory default up-load interval of 1 hour the board is able to bridge any downtime of up to 12 hours without loosing any data.  

Let me configure the board

The board is ready to use without any need to configure it when you get it. It has however various configuration options available.

To prevent un-authorized changes the system is made such that you can only enter configuration mode if you have physical access to the board. To enter configuration mode you connect pin PB0 to GND for a short moment. After that you point your web browser to the IP address that the board has. The board obtains its IP address automatically via DHCP from your DSL router. You can therefore either check your DSL router and see if there is something like a "connected devices" information to guess which IP address the board has or you can simply login to the dashboard as described above and look at the raw data received by the board. The board reports its own interface IP as brdIp. E.g brdIp=192.168.2.3. Just point your web browser to it (e.g http://192.168.2.3 ) For security reasons you have only 3 minutes to reconfigure the board after that it will automatically abort the configuration mode.

[config page for the board]
The board's config page

Each board has its own unique but configurable board ID (bi). That is a number which is assigned to the board and allows you to know from which board a given set of data came. This is useful if you have more than one board reporting data. You can configure the bi in the above dialog.

Apart form the board ID you can configure account information (id and pw) which is used when the board uploads data.

By clicking on the "server" link you can change the place where the board uploads the data to. By entering nothing (deleting the field) you can disable the up-load feature. That is: if you want to use this as a stand-alone web-server only.

By clicking n "[web serv]" you can change the port number that the local web server listens too from default 80 to any other port number.

The "interval" determines how often measurement data is up-loaded. It can be set between 15min and 2hours.

If you ever configured "nonsense" and you want to get back to the factory default settings then you can reset the board as follows. Connect PB0 to GND continuously for 20-30 seconds, then release PB0 again, wait 1-2 seconds and power-cycle the board. This removes all manually configured settings and restores the factory default.  

Using my own server to store the data

If you have your own server and you would like to perform all the processing on your own infrastructure then take a look at the eth_client_temp software in the download directory. Inside the tar.gz file is a perl script called cgi-bin/sdat The README.htm file inside the cgi-bin directory explains how to use it. Basically you just copy the sdat script into the cgi-bin directory on your server and you adjust the password as well as the location were the data should be stored and it is ready to use.

This server can even be on the same LAN and does not have to have a public DNS entry. You can reconfigure the board and specify as a "server" something like http://192.168.1.2/cgi-bin/sdat The embedded client will recongnize the first part of that URL as an IP address and will use it directly without going to a DNS server.  

Diagnostic LEDs

The board offers the possibility to install some diagnostic LEDs. They are optional. The board will work even if you do not install them but they can be very helpful in cases where things don't work as planned.

There are 4 green LEDs (DHCP, Gateway, DNS, data upload) and the red LED D2 (ongoing transaction). The red LED goes on during a transaction and off as soon as it is finished. At power on the board will first try to obtain an IP address, GW and netmask and DHCP LED goes on as soon as this step is completed. Next it will issue an ARP request to get the MAC address of the Gateway and the Gateway LED goes on once this is successful. After that it will issue a DNS query to find the IP address of the server to upload the data to. The DNS LED goes on as soon as it has obtained the IP address via the DNS server.

The board will now wait about 1 minute and after that it will attempt to upload the first set of measurements. The data LED goes on when that is successful. At any future data upload the LED will go off and on again when the upload was successful.

You have as well the status page (described above) generated by the web-server on the board itself which will provide even more information.  

Limitations

The embedded client should work almost everywhere and all you have to do is: connect it to the network and power it on. There are however two cases where it will not work:
  1. In hotels or public places where you are first re-directed to a registration or payment page before you can use the network.
  2. In some companies where the internal network does not provide direct internet access. All internet access to the web must go via a web-proxy.
Basically the system will always work where you have direct internet connectivity available via a NAT-ing router (e.g home networks connected via DSL or Cable, satelite or 4G/3G/UMTS) and direct internet connectivity without NAT.

It is possible to use this over WiFi. See AVR WiFi.  

References/Download


© Guido Socher, tuxgraphics.org

2012-05-10, generated by tuxgrparser version 2.57